Section 1: The Problem
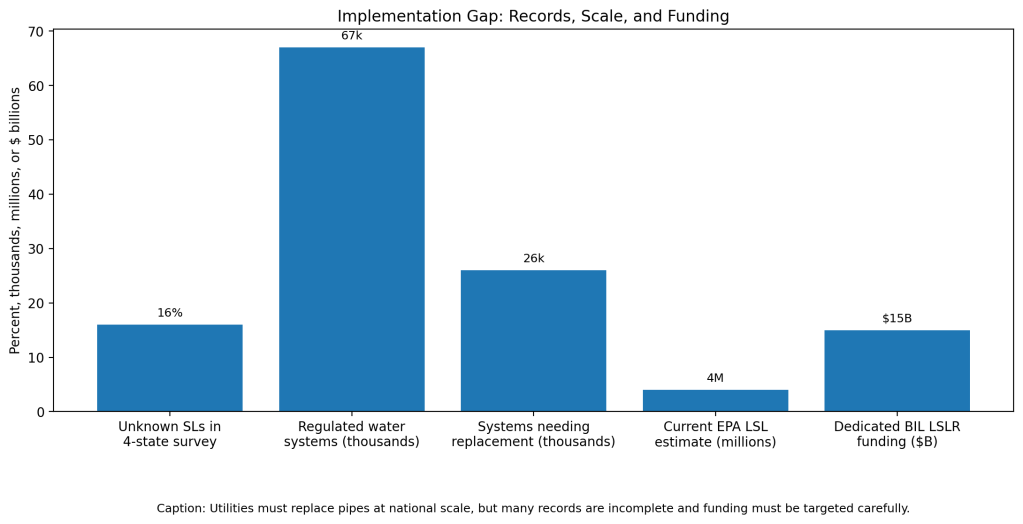
Millions of homes still get water through old lead service lines, but many cities do not know exactly where those pipes are. EPA’s current lead service line page estimates about 4 million lead service lines still serve properties across the United States, and EPA’s 2024 Lead and Copper Rule Improvements require utilities to identify and replace lead pipes within 10 years (EPA).
This is not only an infrastructure issue. Lead in drinking water harms children and adults, and EPA estimates the final rule will create $13.5 billion to $25.1 billion in annual benefits once fully implemented. EPA says benefits include protecting up to 900,000 infants from low birthweight, preventing up to 2,600 children from ADHD, reducing up to 1,500 premature deaths from heart disease, and preventing up to 200,000 lost IQ points in children (EPA).
Traditional pipe replacement starts with old paper records, plumbing cards, city maps, curb inspections, and excavation. The problem is old records are often incomplete or wrong. Hensley and colleagues reviewed lead service line identification methods and reported that surveys in Michigan, Illinois, Wisconsin, and Indiana found an average of 16% of service line materials were unknown and may be lead (Hensley et al.).
Section 2: What Research Shows
Data science changes the work from “dig and hope” to “predict, verify, and update.” Models combine property age, home value, parcel location, historical plumbing rules, known service line records, neighborhood patterns, and field inspection results. The output is not a robot decision. It is a ranked map telling crews which homes are most likely to have lead.
Flint, Michigan became the key case. Abernethy, Chojnacki, Farahi, Schwartz, and Webb built predictive and procedural tools to identify hazardous service lines after government agencies directed more than $125 million toward replacement work (Abernethy et al.). Their KDD paper describes an adaptive system that updated as field crews uncovered new pipe materials, using active learning to make the next round of digging smarter.
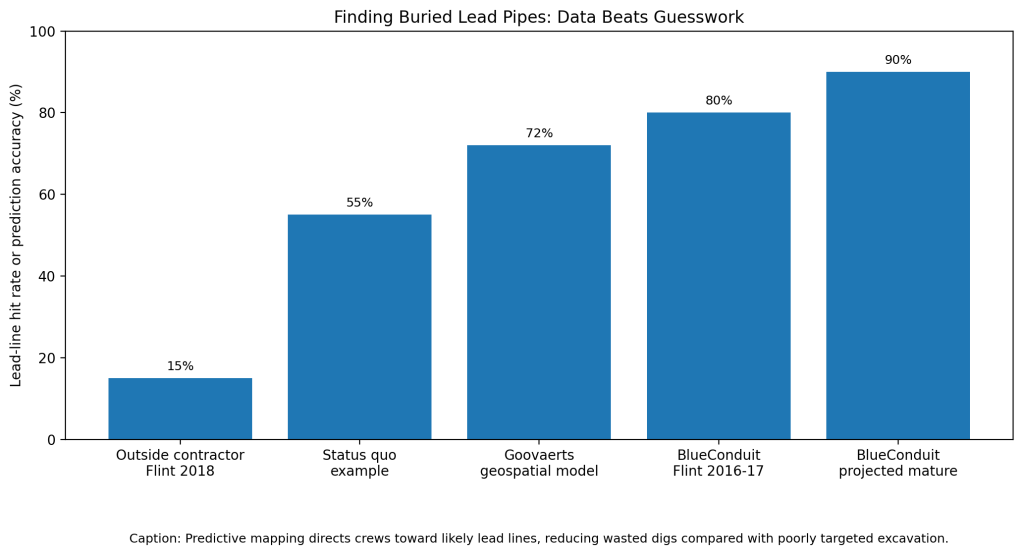
Other models show similar promise. Goovaerts reported a geospatial model for Flint service line composition with AUC improving from 0.6 to 0.8 in a later compositional approach (Goovaerts). New Jersey’s predictive modeling rationale reported about 72% accuracy for Flint geospatial models (NJDEP).
Section 3: What the Real World Shows
Flint showed what happens when prediction guides field work. BlueConduit reported that Flint’s predictive model reached about an 80% hit rate in 2016-2017, while an outside consulting approach in 2018 found lead service lines in only 15% of excavation attempts. A 2019 court settlement required Flint to return to the predictive model (BlueConduit).
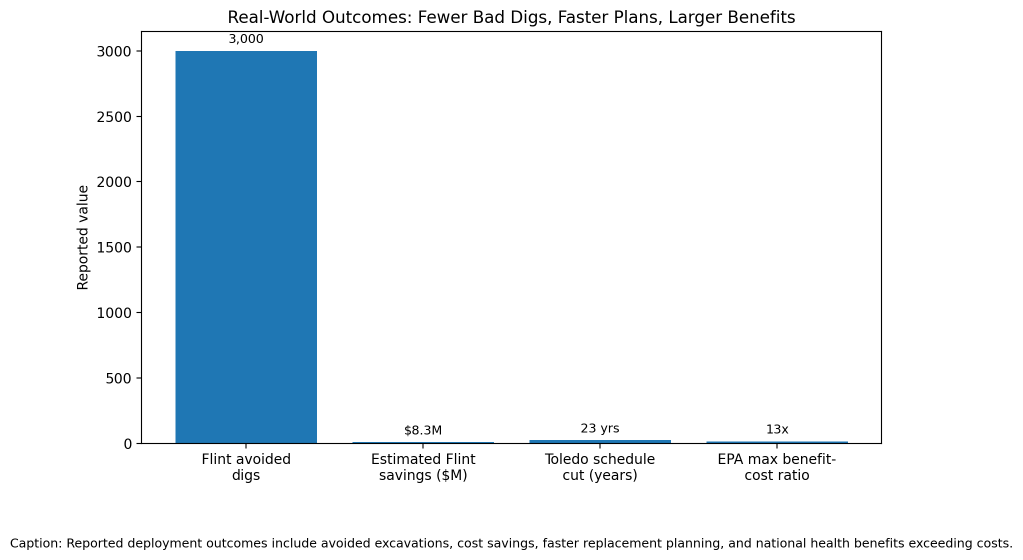
The difference matters because every bad dig wastes labor, money, and resident patience. BlueConduit estimated that better targeting saved Flint tens of millions by avoiding thousands of unnecessary excavations (BlueConduit). Its public presentation modeled $8.3 million in savings and 3,000 avoided excavations using higher hit rates and representative inspections (BlueConduit).
Toledo gives another example. The Environmental Policy Innovation Center reported that predictive service line inventories helped Toledo budget and plan replacement work, cutting the projected end date from 2050 to 2027 (EPIC). That is not a small dashboard improvement. That is 23 years of acceleration in removing pipes that should not be underground anymore.
Section 4: The Implementation Gap
The first gap is record quality. Many utilities have paper cards, scanned PDFs, partial maps, plumber notes, and decades-old assumptions. Hensley’s review names records screening, visual examination, water sampling, excavation, and predictive data analysis as possible strategies, but no single method is perfect for every system (Hensley et al.).
The second gap is sampling bias. Predictive models only work when verified pipe data represents the full system. EPA’s predictive modeling FAQ says utilities should verify materials using a randomly selected, representative sample, demonstrate accuracy for the intended water system, and maintain the model as new information arrives (EPA ORD).
The third gap is funding. EPA estimates annual LCRI costs of $1.47 billion to $1.95 billion, with service line replacement making up $1.17 billion to $1.64 billion per year (EPA). The Bipartisan Infrastructure Law provides $15 billion specifically for lead service line replacement, but cities still need to aim that money carefully (EPA).
The fourth gap is trust. Residents do not want to hear “a model says your house is safe” when the pipe is still buried. Predictive maps need public transparency, confidence scores, and field verification. Without that, a useful tool starts to look like an excuse to delay digging.
Section 5: Where It Actually Works
This works when cities treat prediction as a field strategy, not a final answer. Flint used predictions to prioritize digs and then fed new excavation results back into the model. That loop made the system better over time (Abernethy et al.).
It also works when maps are public. Toledo’s public-facing map let residents see verified and predicted service line materials at individual addresses, which helped turn data work into visible action (EPIC).
Section 6: The Opportunity
The opportunity is not “AI finds pipes.” The opportunity is rebuilding the missing map of buried infrastructure so every excavation has a higher chance of removing lead.
References
[1] U.S. Environmental Protection Agency. “Lead Service Lines.” 2026.
[2] U.S. Environmental Protection Agency. “Lead and Copper Rule Improvements.” 2024.
[3] U.S. Environmental Protection Agency. EPA’s Final Lead and Copper Rule Improvements Technical Fact Sheet: Summary of Benefits and Costs. 2024.
[4] Hensley, Kelsey, Valerie Bosscher, Simoni Triantafyllidou, and Darren A. Lytle. “Lead Service Line Identification: A Review of Strategies and Approaches.” AWWA Water Science, 2021.
[5] Abernethy, Jacob, Alex Chojnacki, Arya Farahi, Eric Schwartz, and Jared Webb. “ActiveRemediation: The Search for Lead Pipes in Flint, Michigan.” KDD, 2018.
[6] Goovaerts, Pierre. “Geospatial Model of Composition of Water Service Lines in Flint, Michigan.” 2023.
[7] New Jersey Department of Environmental Protection. Rationale for Utilizing Predictive Modeling to Identify Lead Service Lines. 2022.
[8] BlueConduit. “BlueConduit’s Impact in Flint.” 2020.
[9] BlueConduit and Freshwater Future. Using AI to Reduce Uncertainty of Lead Service Line Inventories. 2022.
[10] Environmental Policy Innovation Center. “What We Learned About the Lead-Free Water Challenge.” 2022.

Leave a comment