Section 1: The Problem
Bad rental housing is not a niche problem. HUD reported 8.46 million very low-income renter households with “worst case housing needs” in 2023, meaning they either paid more than half their income for rent, lived in severely inadequate housing, or both (HUD). Poor housing quality is tied to mold, pests, lead, crowding, bad ventilation, and missing safety devices, all of which raise risk for chronic disease, injury, and infection (ODPHP).
The health link is not abstract. A national study using 55,281 adults found that each additional poor housing characteristic was associated with worse self-rated health, higher medical use, and higher odds of hospitalization. The odds ratios were 1.17 for poorer health status, 1.11 for higher medical utilization, and 1.07 for hospitalization (Boch et al.).
Traditional code enforcement misses a lot of this because most cities still rely on complaints. That system favors tenants who know their rights, trust government, speak English, and feel safe reporting a landlord. ChangeLab notes that many cities still use complaint-based systems, even though low-income and undocumented renters are often the least likely to complain because of fear of retaliation, rent hikes, or deportation worries (Miao; Gregory Miao is quoted in the piece).
Section 2: What Research Shows
The clearest retrospective evidence comes from Chelsea, Massachusetts. Researchers trained machine learning models on 1,611 proactively inspected properties and then scored all 5,989 residential properties in the city. On held-out test data, the best model for any violation reached sensitivity 0.77, positive predictive value 0.59, and accuracy 0.66. For high-risk violations, the best XGBoost model reached sensitivity 0.41, PPV 0.55, and accuracy 0.63. For overcrowding, the best XGBoost model reached sensitivity 0.09, PPV 0.62, and accuracy 0.74 (Robb et al.).
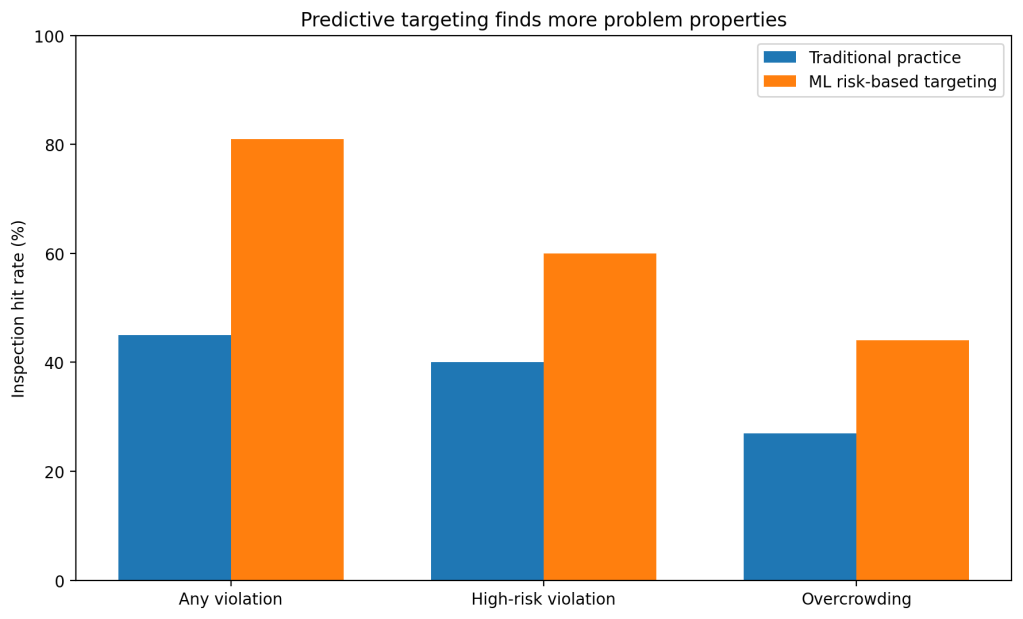
Those numbers matter because the baseline system was weak. Under Chelsea’s usual practice, only 45 percent of inspections found any violation. The model showed that, if the city used its same annual capacity of 600 inspections on the top-ranked properties, 81 percent would be expected to yield a violation. That is a 1.8 times improvement. For high-risk violations, the hit rate rose from 40 percent to 60 percent. For overcrowding, it rose from 27 percent to 44 percent (Robb et al.).
Newer work in New York City pushed the same idea in a different direction. Chakraborty and colleagues linked Medicaid claims to building conditions and built a Housing Health Index to predict which buildings were likely to appear on the city’s Landlord Watchlist. Buildings in the highest decile of the index scored worse across multiple housing-quality indicators, which suggests health data can help target inspections before conditions spiral further (Chakraborty et al.).
Section 3: What the Real World Shows
Chelsea did not stop at model development. The city also built a live referral system around inspections. In the first eight months of the program, inspectors referred 15 residents to social services. Sixty percent accepted help on the first offer, another 27 percent accepted after repeated offers, and residents received an average of nine contacts and three service types. Inspectors reported higher work efficiency and less psychological burden because they now had something better than citations for the hardest cases (Robb et al.).
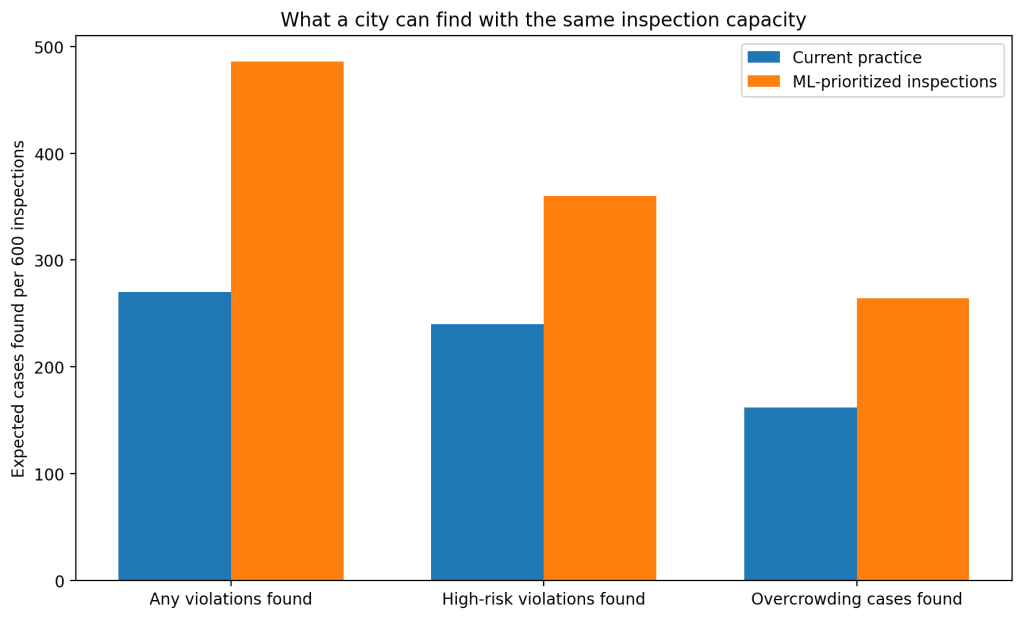
The operational impact from the inspection model was also concrete. With the same 600 inspections per year, Chelsea could expect to find 486 properties with any violation instead of 270. For high-risk violations, the count rose from 240 to 360. For overcrowding, it rose from 162 to 264. No extra inspection staff was required for those gains, which is why this is one of the strongest public-sector examples of data science improving field operations rather than only producing a paper (Robb et al.).
The broader review literature points in the same direction. A 2021 systematic review on housing improvement interventions found benefits in health and cost-effectiveness across prioritized interventions, even though implementation quality varied (Moledina et al.). A 2023 Annual Review paper also concluded that housing quality remains a major driver of health inequality and that enforcement of minimum standards is still uneven despite a solid evidence base (Howden-Chapman et al.).
Section 4: The Implementation Gap
The first barrier is data. A proactive inspection program needs an accurate rental registry and a property database. ChangeLab’s implementation guide says plainly that without accurate rental housing data, it is hard to run code enforcement efficiently. It also warns that technology for data management and scheduling is often a major obstacle, especially in large jurisdictions with tens of thousands of properties (ChangeLab Solutions).
The second barrier is politics and compliance. Proactive systems shift power away from complaint-only enforcement, which means landlords have to register properties, allow routine inspections, and pay for repairs. The same guide notes that lack of tenant participation leads to failed inspections, and landlord cooperation is central because owners may lack resources or resist the process outright (ChangeLab Solutions).
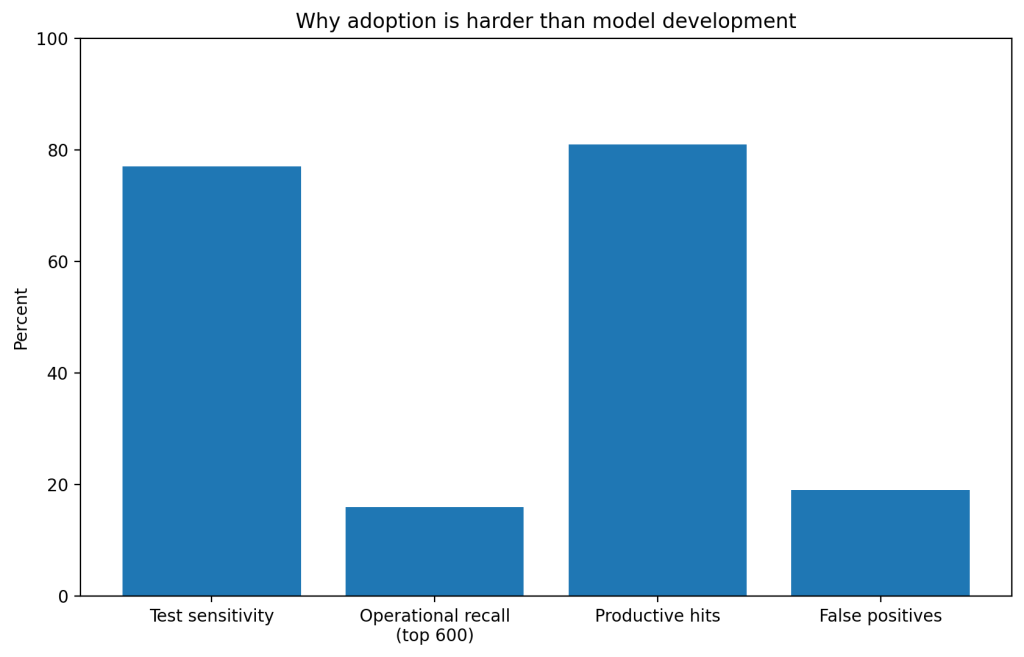
The third barrier is that field performance is less clean than model performance. Chelsea’s any-violation model looked strong on test data with 0.77 sensitivity, but when the city constrained the model to the top 600 properties it could inspect each year, operational sensitivity dropped to 16 percent. In other words, the model was good at making the inspection queue much more productive, but it still left many risky properties uninspected. The top-600 list also implied a 19 percent false-positive share because 81 percent, not 100 percent, of prioritized inspections were expected to find a violation (Robb et al.). City leaders often see those tradeoffs and hesitate.
The fourth barrier is scale. ChangeLab says more than 25 U.S. cities and counties have proactive rental inspection programs. That is real progress, but still small relative to the size of the American rental market and the 8.46 million households with worst-case needs. The evidence is not the main shortage. Administrative capacity is (Miao; HUD).
Section 5: Where It Actually Works
This works best in cities with three things: a rental registry, integrated municipal data, and inspectors who help design the workflow. Chelsea succeeded because the city already had proactive inspections, city leadership backed the project, and the referral system made inspectors’ jobs easier rather than harder (Robb et al.).
It also works when inspection is treated as a service operation, not only an enforcement tool. Chelsea paired inspection with social-service referrals. That reduced repeat dead-end cases and made the system more acceptable to frontline staff and residents (Robb et al.).
Section 6: The Opportunity
The opening is simple. Cities do not need a flashy AI product. They need cleaner rental data, a prioritization model, and a workflow that inspectors trust. That combination can turn the same inspection capacity into far more useful inspections and earlier interventions (Robb et al.; ChangeLab Solutions).
Takeaways
- Build or clean a rental registry first.
- Optimize for workflow, not leaderboard metrics alone.
- Pair inspection targeting with repair aid or service referral.
- Track field metrics such as hit rate, missed-risk rate, and repeat violations.
- Audit for equity so targeting does not ignore underreported neighborhoods.
Charts
References
[1] Robb, Katharine, et al. “Using Integrated City Data and Machine Learning to Identify and Intervene Early on Housing-Related Public Health Problems.” Journal of Public Health Management and Practice, 2022.
[2] Robb, Katharine, et al. “Further Inspection: Integrating Housing Code Enforcement and Social Services to Improve Community Health.” International Journal of Environmental Research and Public Health, 2021.
[3] Chakraborty, O., et al. “Housing-Sensitive Health Conditions Can Predict Poor-Quality Housing.” Health Affairs, 2024.
[4] Boch, Samantha J., et al. “‘Home Is Where the Health Is’: Housing Quality and Adult Health Outcomes in the Survey of Income and Program Participation.” Preventive Medicine, 2020.
[5] U.S. Department of Housing and Urban Development. Worst Case Housing Needs: 2025 Report to Congress. 2025.
[6] Office of Disease Prevention and Health Promotion. “Quality of Housing.” Healthy People 2030.
[7] ChangeLab Solutions. “Proactive Rental Inspections (PRI) for Healthy Homes.” 2021.
[8] ChangeLab Solutions. A Guide to Proactive Rental Inspections. 2022.
[9] Moledina, A., et al. “A Comprehensive Review of Prioritised Interventions to Improve the Health and Wellbeing of Persons Living in Temporary Accommodation and Informal Settlements.” 2021 systematic review.
[10] Howden-Chapman, Philippa, et al. “Review of the Impact of Housing Quality on Inequalities in Health and Well-Being.” Annual Review of Public Health, 2023.

Leave a comment