Section 1: The Problem
Illegal, unreported, and unregulated fishing is not a side issue in ocean policy. FAO estimates it accounts for about 20 percent of the world’s catch, up to 26 million tonnes of fish each year, which means a large share of seafood is still moving through the global system outside the rules meant to protect stocks and coastal livelihoods (FAO). More than one billion people rely on the ocean as their primary food source, and about 260 million people work in marine fisheries, so poor monitoring does not only hurt ecosystems. It also hits food security, jobs, and the legal fishing industry that plays by the rules (Paolo et al.).
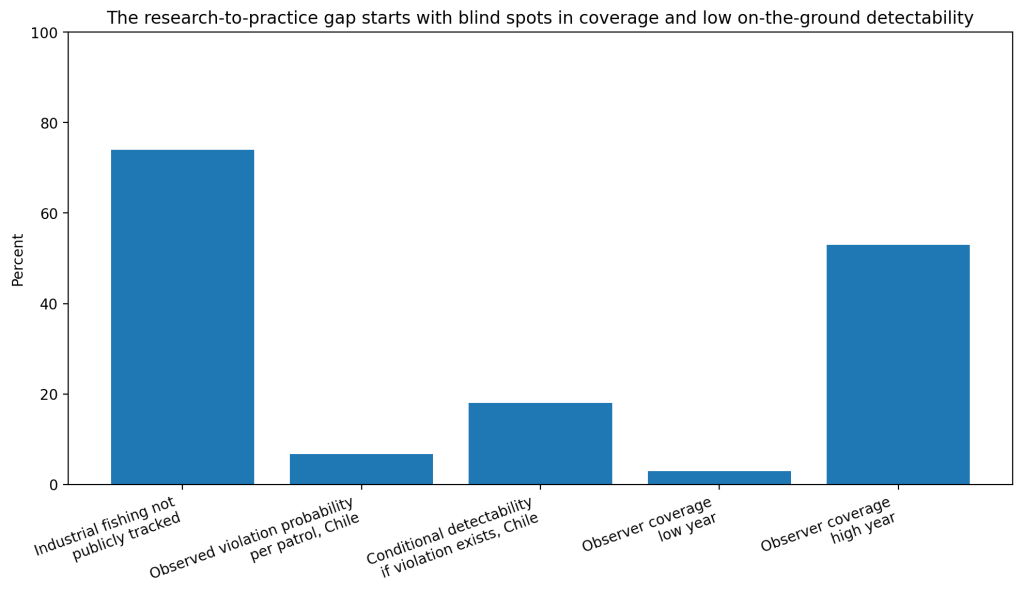
The old monitoring model leaves huge blind spots. Public vessel tracking systems do not come close to seeing all industrial fishing activity. A 2024 Nature study that combined satellite imagery, vessel GPS data, and deep learning found that 72 to 76 percent of the world’s industrial fishing vessels are not publicly tracked, with the biggest gaps in South Asia, Southeast Asia, and Africa (Paolo et al.). In plain terms, regulators are often trying to stop illegal fishing while missing most of the board (Paolo et al.).
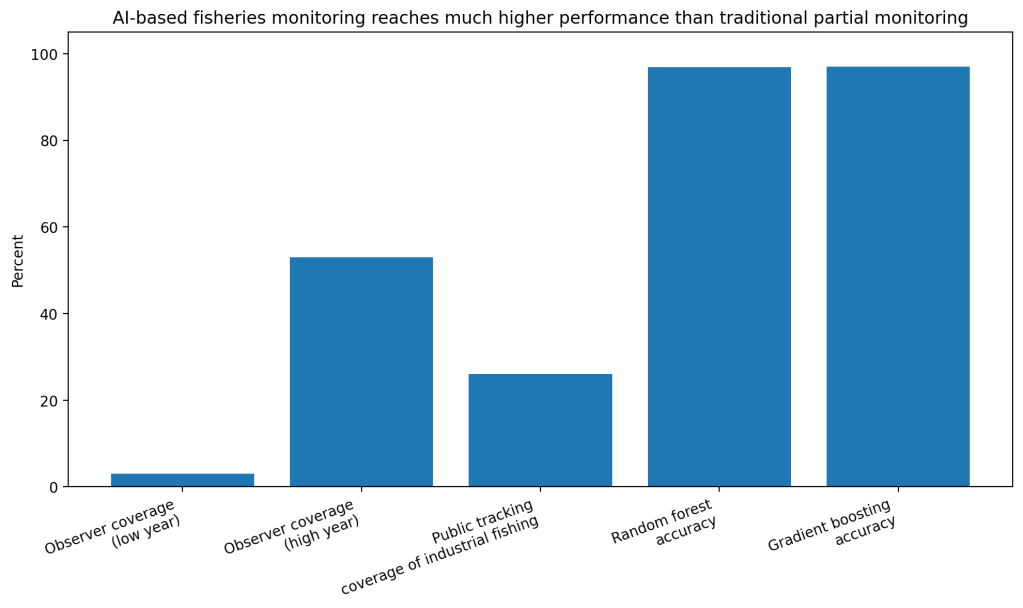
Traditional oversight also tends to be sparse even when governments do collect good data. On the U.S. West Coast fixed-gear groundfish fishery, annual observer coverage ranged from only 3 to 53 percent of landings depending on the year and gear type. That is useful, but still leaves a large share of trips outside direct observation, which is exactly where data science starts to matter (Watson et al.).
Section 2: What Research Shows
The retrospective results are strong. Watson and colleagues built random forest and gradient boosting classifiers using more than 10,000 labeled landing records linked to observer data. On held-out test data, the random forest model reached 96.9 percent accuracy, 0.971 precision, 0.971 recall, and 0.971 F1. The gradient boosting model reached 97.0 percent accuracy, 0.971 precision, 0.973 recall, and 0.972 F1. Across annual holdout tests from 2002 to 2019, mean accuracy stayed at 0.969 to 0.970, which is unusually stable for a real fishery dataset (Watson et al.).
The larger remote-sensing picture is just as important. Paolo and colleagues used satellite SAR imagery, GPS vessel positions, and deep learning to map industrial vessel activity across the world’s coastal waters from 2017 to 2021. Their work showed that high-resolution AI mapping reveals fishing patterns that public AIS products miss, including hotspots around Indonesia, South Asia, West Africa, and marine protected areas. That is a direct improvement over older systems that depend mainly on self-reporting and public broadcasts (Paolo et al.).
Recent reviews reinforce the same pattern. Yang and colleagues’ 2024 review of AIS-driven maritime machine learning found that ML is now central for anomaly detection, route analysis, and vessel behavior modeling, but the field still lacks benchmark datasets and more standardized evaluation. A 2026 fisheries AI review reached a similar conclusion: AI is improving illegal-fishing detection, but operational use remains inconsistent because labeled data, benchmarking, and deployment standards are still weak (Yang et al.; Haque et al.).
Section 3: What the Real World Shows
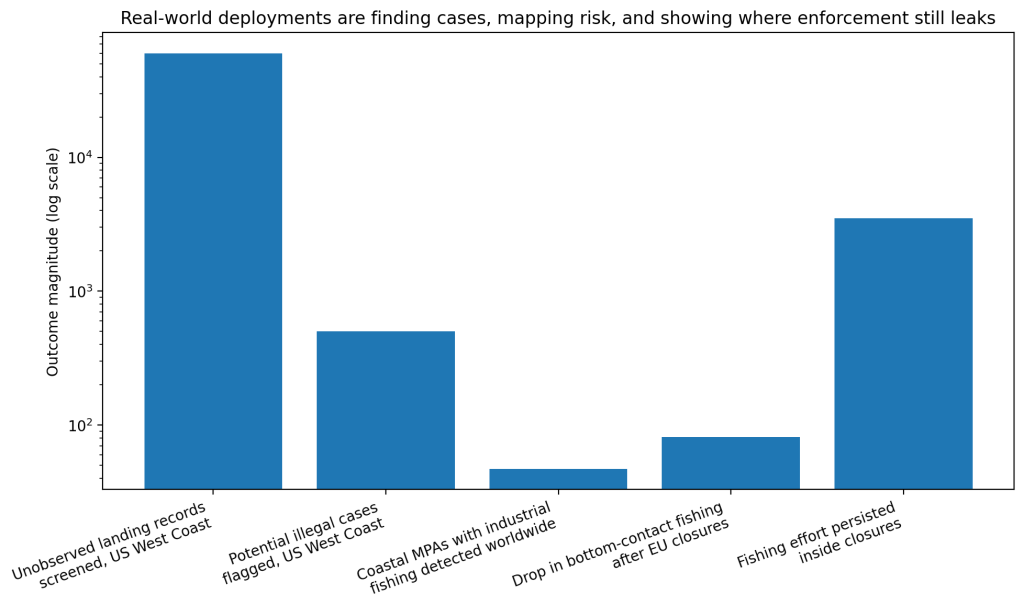
The most convincing field example comes from the U.S. West Coast. The Watson study was not only a retrospective exercise. It was built at the request of fisheries enforcement investigators, then moved into operations. The automated system now analyzes all new unobserved landing records and flags those needing additional review. After screening nearly 60,000 unobserved records, the system identified more than 500 instances in which vessels may have illegally fished in federal waters. That is a real enforcement workflow, not a lab demo (Watson et al.).
Satellite monitoring has also changed what agencies can see at scale. A 2025 Science study found industrial fishing in 47.1 percent of the 6,021 coastal marine protected areas it examined. Another 2025 Science study found that fully and highly protected marine areas had little to no industrial fishing, which shows the technology is useful both for catching violations and for verifying that strong protections work when they are enforced (Seguin et al.; Raynor et al.).
There are also cases where data-rich monitoring shows clear policy effects. Victorero and colleagues analyzed public AIS data after the European Commission closed 87 vulnerable marine ecosystem zones to bottom fishing in 2022. In the following year, bottom-contact fishing effort inside those areas fell by 81 percent. But about 3,500 hours of bottom-contact fishing still persisted inside closures, which is exactly the kind of mixed result that makes informatics useful: it shows progress, and it shows leakage (Victorero et al.).
Section 4: The Implementation Gap
The first barrier is coverage. Illegal fishing happens where observation is weakest. Paolo’s global mapping study showed that about three-quarters of industrial fishing activity is missing from public tracking. Watson’s West Coast case showed that direct observer coverage can be as low as 3 percent in some years. You cannot deter what you barely see (Paolo et al.; Watson et al.).
The second barrier is low real-world detectability even when patrols exist. In Chile, Oyanedel and colleagues used a Bayesian hierarchical model on a large enforcement dataset and found that the overall probability of observing a violation during a land-based enforcement patrol was only 6.7 percent. Conditional on a violation actually taking place, mean detectability was only 18 percent. That is the core implementation problem in one number: even when agencies are active, most violations still go unseen (Oyanedel et al.).
The third barrier is fragmented data. Reviews keep pointing to the same practical problems: weak benchmark datasets, inconsistent AIS quality, spoofing or disabling of vessel signals, limited integration across catch records, satellite feeds, port inspections, and supply-chain traceability. The models are improving faster than the governance stack around them (Yang et al.; Cromwell et al.).
The fourth barrier is trust and workflow design. Fisheries officers do not need a black box that says “something is wrong.” They need ranked cases, interpretable flags, and systems that fit inspections, audits, and port controls. The West Coast example worked because the model was built with enforcement investigators and inserted into a real review pipeline. Many papers stop before that step (Watson et al.; Welch et al.).
Section 5: Where It Actually Works
This technology works best in narrow, operational jobs. Screening unobserved landings for suspicious cases works. Mapping industrial fishing inside protected areas works. Tracking whether closures reduce fishing effort works. All three cases use data science to prioritize human enforcement rather than replace it (Watson et al.; Victorero et al.; Seguin et al.).
It also works when the data streams are combined. Catch records, observer data, AIS, satellite imagery, and port controls each miss something on their own. Together, they start to close the blind spots. That is the broader lesson running through the recent fisheries AI literature (Watson et al.; Yang et al.; Haque et al.).
Section 6: The Opportunity
Illegal fishing is one of the clearest cases where data science already outperforms traditional monitoring, but adoption is still uneven because surveillance systems remain fragmented, underfunded, and too dependent on partial coverage. The next gains will not come from one more model. They will come from linking satellite monitoring, landings data, inspections, and traceability into a single enforcement workflow (Paolo et al.; Oyanedel et al.; Cromwell et al.).
Takeaways
- Build systems that rank inspection targets, not systems that try to replace officers.
- Combine AIS, satellite imagery, catch records, and port data in one pipeline.
- Track real operational metrics, like cases flagged, patrol hit rates, and violations found.
- Invest in benchmark datasets and explainable alerts so agencies trust the outputs.
- Focus on places with the largest blind spots first, especially regions where public tracking is weakest.
Charts
References
[1] Food and Agriculture Organization of the United Nations. “Illegal, Unreported and Unregulated (IUU) Fishing.” FAO, 2026.
[2] Paolo, Fernando S., et al. “Satellite Mapping Reveals Extensive Industrial Activity at Sea.” Nature, vol. 625, 2024, pp. 85–92.
[3] Watson, Jordan T., et al. “Fishery Catch Records Support Machine Learning-Based Prediction of Illegal Fishing off US West Coast.” PeerJ, vol. 11, 2023, e16215.
[4] Yang, Ying, et al. “Harnessing the Power of Machine Learning for AIS Data-Driven Maritime Research: A Comprehensive Review.” Transportation Research Part E, vol. 185, 2024, 103426.
[5] Haque, S. A., et al. “Applications of Artificial Intelligence in Fisheries: From Data to Decision Support.” AI, vol. 10, no. 1, 2026, 19.
[6] Oyanedel, Rodrigo, et al. “Improving Detectability of Illegal Fishing Activities Across Supply Chains.” npj Ocean Sustainability, 2025.
[7] Seguin, R., et al. “Global Patterns and Drivers of Untracked Industrial Fishing in Coastal Marine Protected Areas.” Science, 2025.
[8] Raynor, J., et al. “Little-to-No Industrial Fishing Occurs in Fully and Highly Protected Marine Protected Areas.” Science, 2025.
[9] Victorero, Luis, et al. “Tracking Bottom-Fishing Activities in Protected Vulnerable Marine Ecosystem Areas and Below 800-m Depth in European Union Waters.” Science Advances, vol. 11, 2025.
[10] Cromwell, James, et al. “Digital Technologies for Traceability and Transparency in the Fish Supply Chain: A Review.” Marine Policy, vol. 177, 2025, 106620.

Leave a comment