Section 1: The Problem
In 2022, global aquatic animal production had an estimated first-sale value of about USD 452 billion, and fisheries and aquaculture employed about 61.8 million people. (FAO) (FAOHome) The problem is not a lack of fishing data, it is a lack of trusted fishing data. Catch gets misreported, discards stay invisible, and protected-species interactions get missed because nobody is watching most of the time. (Pierre) (PMC)
Bycatch is the blunt edge of this gap. Some global estimates put bycatch near 40% of the world’s catch, around 63 billion pounds per year. (Keledjian) (Oceana) Even in well-managed fisheries, rare events matter most, a few protected-species interactions can drive closures, lawsuits, and long-term population impacts. (Long) (Frontiers)
Traditional monitoring leans on paper logbooks and human observers. Observers work, but they are expensive, hard to scale, and sometimes unsafe or impractical in rough weather or remote trips. (NOAA) (NOAA Fisheries) In Alaska’s North Pacific Observer Program, the average cost per observer sea day was reported as $1,381 in 2020. (NOAA) (NOAA Institutional Repository) When budgets tighten, coverage drops, and the whole system runs on thin sampling.
Section 2: What Research Shows
Electronic monitoring (EM) puts cameras, sensors, and GPS on vessels, then reviews video onshore. Research keeps showing EM plus computer vision can do the hardest part, finding fish and events in messy video, with accuracy that competes with humans while scaling beyond human hours. (Saqib; Wilson; Khokher) (ScienceDirect)
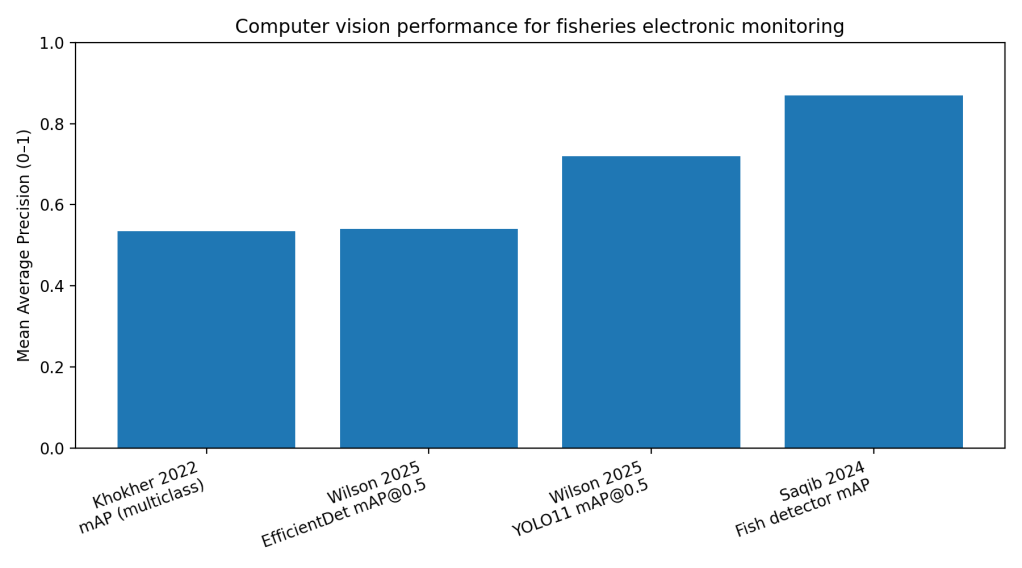
On Australian longline vessels, a CSIRO-led team built an end-to-end pipeline to detect fish, detect fishing events, and classify species from EM footage. Their fish-and-fisher detector reached 87% mean average precision (mAP) for fish and 94% mAP for fishers on test frames, and their fish species classifier hit 91.11% top-1 accuracy on cropped fish images. (Saqib) (ScienceDirect) In a tougher “real deck” setup, a separate team reported a multiclass detector mAP of 53.42% but still produced automated counts within two standard deviations of manual counts for target species most of the time. (Khokher) (bmis-bycatch.org)
In Alaska pollock trawl videos, researchers trained open-source detectors to find salmon and pollock in high-density net footage. YOLO11 achieved mAP@0.5 of 0.72 and mean average recall (mAR@0.5) of 0.90, outperforming EfficientDet at mAP@0.5 of 0.54 and mAR@0.5 of 0.83. (Wilson) The key point is not a single leaderboard number. It is that these models now perform in the same range as human-to-human variability in annotation. (Wilson)
Section 3: What the Real World Shows
The strongest evidence is no longer “it works on a dataset.” It is “it changes the workload and the timeline on real trips.”
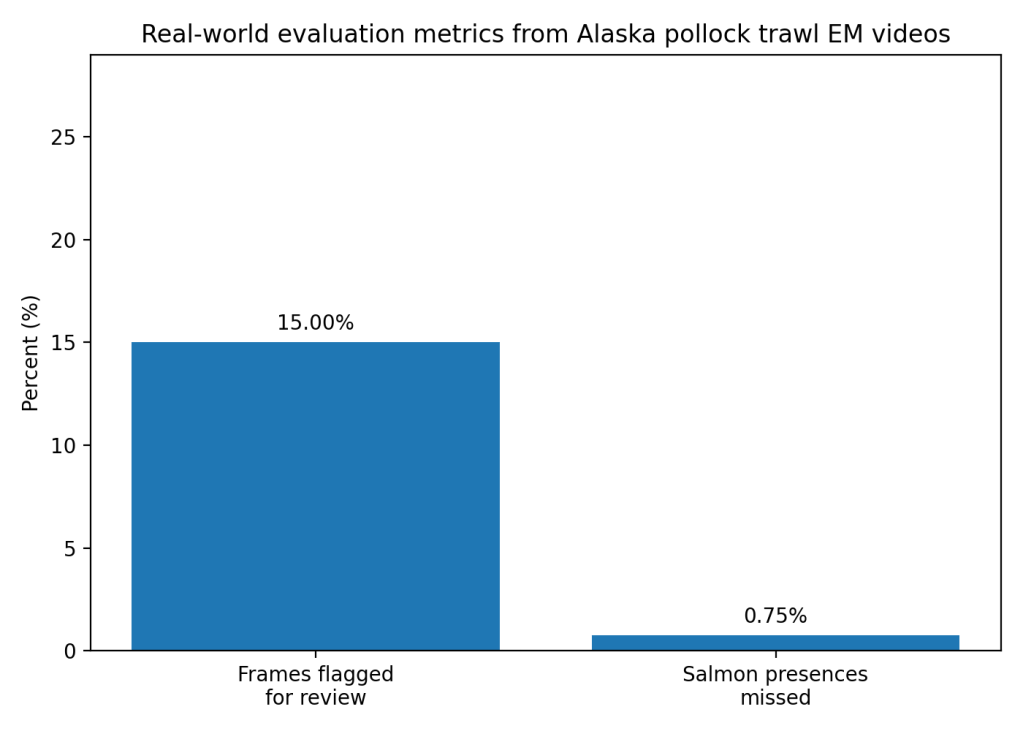
In the Alaska pollock work, the team applied their best model to full fishing tows and built a salmon-presence workflow aimed at semi-automated review. Salmon presence was predicted for 15% of total video frames, and only 5 of 664 salmon presences were missed. (Wilson) They also report that thresholding and filtering excluded over 80% of video frames from potential review while missing fewer than 1% of salmon. (Wilson) Processing ran at about 90 frames per second, meaning tows processed in hours, while experienced human review can take days to weeks. (Wilson) That is a real operational outcome, faster answers for bycatch research and faster feedback loops for mitigation gear.
Systematic and review work supports the same pattern. EM has been implemented on a trial or routine basis in more than 100 fisheries, and review costs depend heavily on how much video gets watched and how well programs design sampling and automation. (Pierre) (PMC) Reviews of AI and computer vision in fisheries also converge on the same conclusion: model capability is rising fast, but deployment constraints and data limitations dominate outcomes. (Barbedo; Kühn; Haque) (ResearchGate)
Section 4: The Implementation Gap
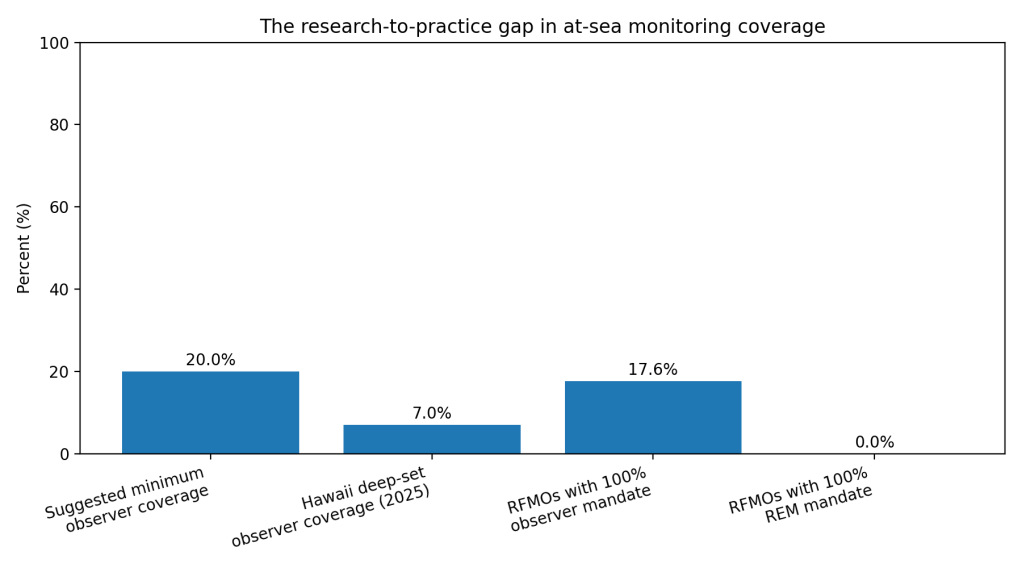
Coverage rules lag behind the evidence. A cross-RFMO analysis found only 3 of 17 RFMOs mandate 100% human observer coverage, and none mandate 100% at-sea monitoring coverage using remote electronic monitoring (REM). (Ewell) (ScienceDirect) So even where EM exists, regulators often treat it as optional, partial, or experimental.
Money drives day-to-day reality. One analysis argues 20% observer coverage is often treated as a minimum for reliable scientific monitoring, especially when rare events matter. (Rogers and Squires) (bmis-bycatch.org) Yet program documents show how quickly real coverage can fall. In Hawaii’s deep-set longline fishery, observer coverage was reported as 7% in 2025, down from 13% in 2024 and 15% in 2023. (Western Pacific Fishery Management Council) (Western Pacific Fishery Council) EM could fill that gap, but many EM programs require fishers to pay some installation or operating costs, which creates pushback and uneven adoption. (Wing)
Workflow friction is the silent killer. Video is heavy, review is slow, and reviewers spend large blocks of time watching routine sorting to verify discards. Automation helps most when it reduces what humans must watch and when it plugs into existing audit practices. (Pierre; EM4) (PMC) Even strong models still need humans “in the loop” to verify detections and resolve edge cases, which limits how much staffing and budget you can truly remove. (Wilson)
Trust and governance issues block scale. Fishers worry about privacy, data ownership, and data being reused for enforcement beyond the original purpose. (Wing; Silva) Regulators worry about defensibility in court, standardization across vendors, and what happens when a model drifts across vessels, seasons, and camera setups. (Wing; Hasegawa)
Section 5: Where It Actually Works
It works best in narrow, high-value tasks with clear objectives and controlled camera geometry. The Alaska pollock example focused on salmon presence in trawl footage and showed large workload reductions without blowing up miss rates. (Wilson) The Australian longline work succeeded in part because it used real EM trips and built an explicit pipeline from detection to event counting to species classification. (Saqib) (ScienceDirect)
Programs also do better when they design for review efficiency from day one, using stratified sampling, defined monitoring objectives, and automation as a review-assist instead of a full replacement. (Pierre) (PMC)
Section 6: The Opportunity
The next jump in impact is not a better model, it is a better product and a better contract between fishers, vendors, and regulators.
Takeaways you can act on
- Set one primary monitoring question per program phase, then automate that first. (Pierre) (PMC)
- Use “review triage” as the default, flag 10–20% of frames for humans, and measure misses like the Alaska pollock workflow did. (Wilson)
- Write data-use rules up front: who owns footage, who can access it, and what secondary use is allowed. (Wing; Silva)
- Require periodic re-validation across vessels and seasons, and budget for labeling as operations, not research. (Wing; Wilson)
- Pay for EM like shared infrastructure, not a penalty on compliant fishers, so adoption does not collapse when margins tighten. (Wing)
Data Visualizations
- Comparison chart, model accuracy vs alternatives
2. Outcomes chart, real-world field evaluation metrics
3. Implementation gap chart, coverage and mandate gaps
References
[1] Saqib, Muhammad, et al. “Fishing Event Detection and Species Classification Using Computer Vision and Artificial Intelligence for Electronic Monitoring.” Fish and Fisheries Research, 2024. (ScienceDirect)
[2] Wilson, Katherine C., et al. “Automated Fish Detection in Videos to Support Commercial Fisheries Bycatch Reduction Efforts.” ICES Journal of Marine Science, 2025.
[3] Khokher, M. Rizwan, et al. “Early Lessons in Deploying Cameras and Artificial Intelligence Technology for Fisheries Catch Monitoring.” Canadian Journal of Fisheries and Aquatic Sciences, 2022. (bmis-bycatch.org)
[4] Pierre, J. P., et al. “Optimising the Review of Electronic Monitoring Information for Management of Commercial Fisheries.” Reviews in Fish Biology and Fisheries, 2024. (PMC)
[5] Wing, K., et al. “Advancing Artificial Intelligence in Fisheries Requires Novel Collaborations.” ICES Journal of Marine Science, 2024.
[6] Ewell, Christopher, et al. “An Evaluation of Regional Fisheries Management Organization At-Sea Compliance Monitoring.” Marine Policy, 2020. (ScienceDirect)
[7] Food and Agriculture Organization of the United Nations. “The State of World Fisheries and Aquaculture 2024” and “World Fisheries and Aquaculture at a Glance.” FAO, 2024. (maring.org)
[8] NOAA Fisheries. “North Pacific Observer Program 2020 Annual Report.” NOAA, 2021. (NOAA Institutional Repository)
[9] Rogers, A., and Squires, D. “Assessing the Potential Costs and Benefits of Electronic Monitoring.” 2022. (bmis-bycatch.org)
[10] Silva, J. A., et al. “Assessing the Drivers of Vessel Tracking Systems Adoption.” Ocean and Coastal Management, 2022. (ScienceDirect)

Leave a comment