Section 1: The Problem
Wildlife poaching is not random. It clusters around roads, rivers, park edges, and known animal movement corridors, then shifts when patrol patterns shift (Xu et al. 2019). Rangers work with thin staffing, huge terrain, and imperfect visibility, so a snare hidden five feet off-trail can sit for weeks even inside a “patrolled” area (Xu et al. 2019).
The incentives for poachers are massive. The black market for illegal wildlife products reaches up to about $20B per year, and organized crime often sits behind the trade (Interpol 2023). In Southeast Asia, wire snaring has turned into an industrial-scale trap problem, with an estimated 12.3 million snares in protected areas across Cambodia, Lao PDR, and Viet Nam (WWF 2020). Removing snares costs money, time, and risk, and teams still miss most traps because they cannot search every meter (Tilker et al. 2024).
Traditional anti-poaching planning leans on experience, intuition, and yesterday’s incidents. This breaks down when staff rotates, when poachers adapt, and when patrol effort itself biases the data, because rangers only record what they notice along the routes they walk (Xu et al. 2019). The result is a feedback loop: patrol where you expect trouble, record trouble where you patrol, then patrol there again.
Section 2: What Research Shows
Poaching prediction looks like a classic “needle in a haystack” problem. In one PAWS dataset, labels were so imbalanced that up to 99.6% of grid cells had no recorded poaching activity, even though true poaching could still exist there (Xu et al. 2019). Naive methods end up near chance performance.
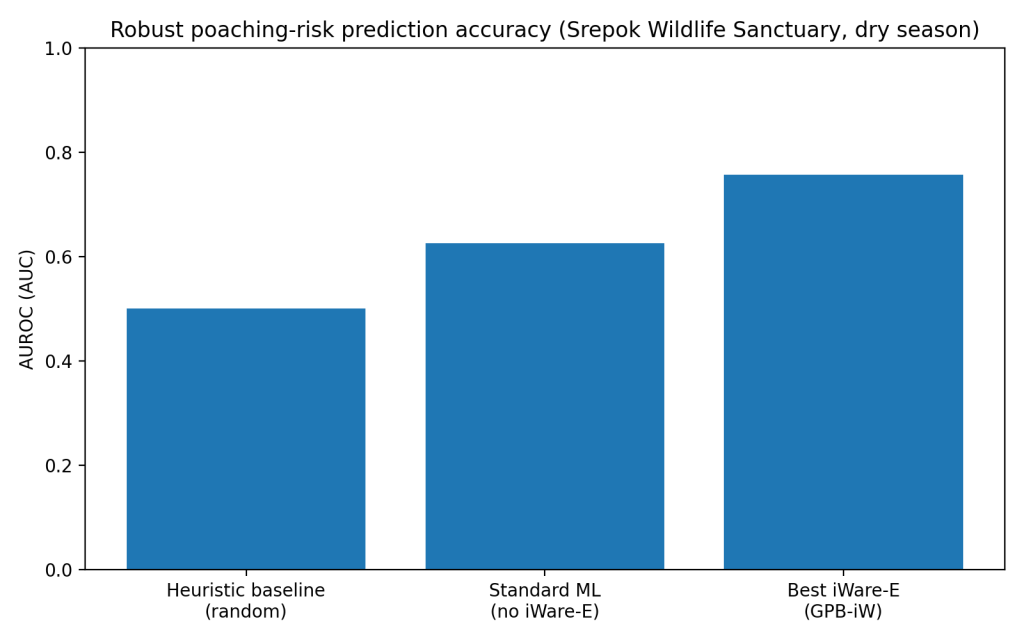
PAWS-style pipelines treat a park as a grid, combine patrol logs with geospatial features (roads, rivers, terrain, habitat), then output a risk score per cell, which can drive patrol planning (Xu et al. 2019). In Srepok Wildlife Sanctuary’s dry season, a simple baseline sat near AUC 0.50, while a stronger non-robust ML option reached AUC 0.626, and the best robust iWare-E configuration hit AUC 0.757 (Xu et al. 2019). That is a meaningful separation between “guessing” and “ranking risk.”
Other anti-poaching work shows similar gains when models move beyond single-method prediction and into patrol-route optimization. A 2019 field-oriented multimodal planning approach in a China reserve reported model-driven precision around 0.63 in offline testing (Chen et al. 2021). The key point is not one perfect model. It is consistent lift over intuition-only planning in the same data conditions rangers face.
Section 3: What the Real World Shows
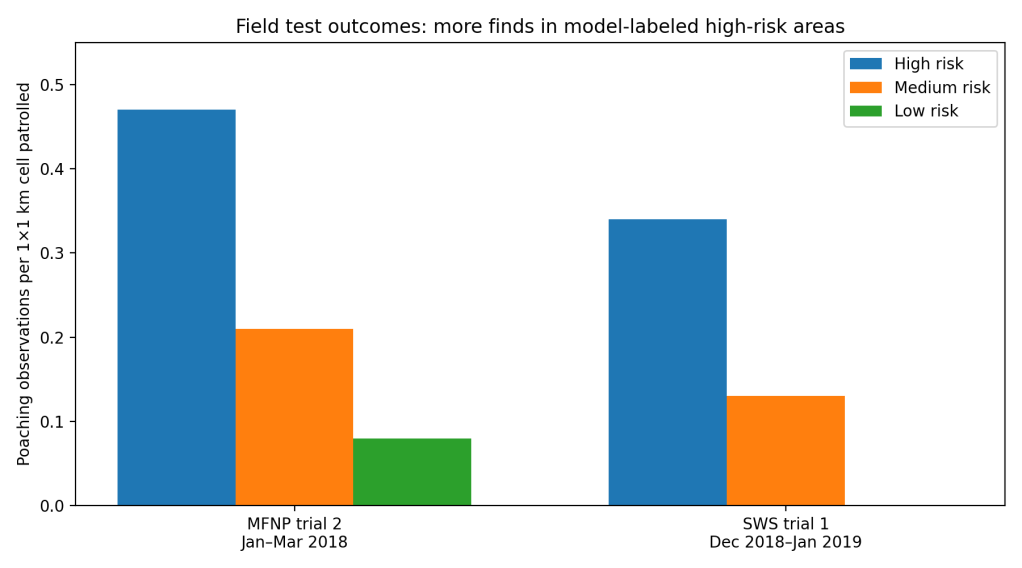
The strongest evidence comes from controlled field tests where rangers patrol high-, medium-, and low-risk areas without being told which is which, then researchers compare what rangers actually find (Xu et al. 2019). In Murchison Falls National Park (Uganda), a multi-month trial recorded higher poaching observation rates in high-risk cells than low-risk cells, including a January–March 2018 segment with 0.47 observations per patrolled cell in high-risk zones versus 0.08 in low-risk zones (Xu et al. 2019). In Srepok Wildlife Sanctuary (Cambodia), a Dec 2018–Jan 2019 segment found 0.34 observations per patrolled cell in high-risk zones versus 0.00 in low-risk zones (Xu et al. 2019).
Those results matter because they translate into time saved and traps removed. In the same PAWS work, the authors report that using uncertainty-aware methods increased snare detection by an average of 30% (Xu et al. 2019). In a separate deployment-style field test at Jilin Huangnihe National Nature Reserve (China) in December 2019, rangers found 42 snares during the test period, described as significantly higher than the historical record for that site (Chen et al. 2021).
System-level reviews of conservation technology keep landing on the same theme: models and sensors are improving faster than organizations absorb them. A 2025 synthesis of conservation technology highlights the scale of threats like snaring and the need to connect tools to on-the-ground workflows and capacity, not only publish better algorithms (Lynam et al. 2025). A 2023 paper on evidence-informed conservation argues that organizational processes and decision context often block adoption even when evidence exists (Mahajan et al. 2023).
Section 4: The Implementation Gap
Data quality is the first hard wall. Patrol data is “presence-only” in practice: a found snare is real, but “no snare found” often means “we did not walk close enough to see it” (Xu et al. 2019). That creates one-sided label noise and can punish models that do not account for detection probability. It also makes frontline staff skeptical, because they know the map is built from incomplete observations.
Workflow friction is the second wall. Patrol planning is a daily, time-constrained task. If the tool produces risk maps that do not match available vehicles, fuel, staffing, terrain constraints, or safety rules, managers fall back to habit (Chen et al. 2021). Multimodal realities, drive, drop-off, foot patrol, pick-up, complicate routes, and many tools still assume cleaner movement than real patrols allow (Chen et al. 2021).
Trust and accountability form the third wall. A bad patrol recommendation has a visible cost: wasted effort, missed poachers, ranger risk. A good recommendation is harder to attribute because “nothing happened” might mean deterrence or luck. Even in the PAWS field tests, researchers noted rangers already spent more effort in high-risk areas, suggesting strong prior beliefs, so the tool must earn trust beyond what experienced teams already suspect (Xu et al. 2019). That trust problem grows when staff turnover is high and training time is scarce.
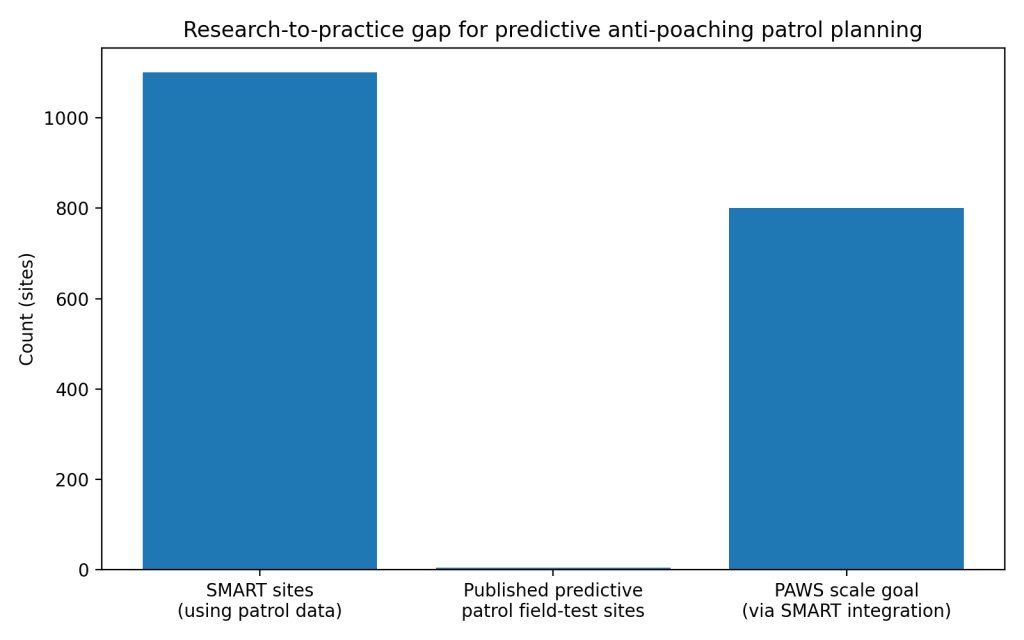
Finally, scaling requires institutions, not pilots. SMART is used at more than 1,100 sites in over 95 countries (SMART Conservation Tools 2026). Yet the number of widely published, predictive patrol planning field-test sites is still small, with named examples including Queen Elizabeth (Uganda), Murchison Falls (Uganda), Srepok (Cambodia), Jilin Huangnihe (China), and a SMART-integrated PAWS field test in Rio Bravo (Belize) (Xu et al. 2019; Chen et al. 2021; SMART Conservation Tools 2022). That is the core gap: the monitoring platform scaled, but predictive decision support has not scaled at the same rate.
Section 5: Where It Actually Works
It works where the deployment design treats rangers as co-owners of the tool. PAWS field tests reduced bias by hiding risk labels from rangers during evaluation, then used results to build confidence in the map before changing planning behavior (Xu et al. 2019). It also works where the tool integrates with systems teams already use. The PAWS program explicitly aimed for integration with SMART to reach hundreds of parks, because a standalone model is harder to operationalize than a feature inside a familiar workflow (Xu et al. 2019).
It also works in constrained, well-scoped settings. The multimodal patrol planning work in China tied prediction to a specific reserve, specific movement modes, and a planning algorithm built around realistic patrol constraints, then validated in a focused field test (Chen et al. 2021). Narrow scope helped adoption.
Section 6: The Opportunity
The opportunity is not “better accuracy.” The opportunity is operational reliability: risk maps that teams trust, routes that match constraints, and evaluation that proves value without extra burden.
Takeaways
- Treat patrol data as detection-biased, model detection probability, not only poaching risk (Xu et al. 2019).
- Ship tools inside the platforms rangers already run daily, especially SMART, not as separate research dashboards (SMART Conservation Tools 2026; Xu et al. 2019).
- Run controlled field tests as a default, with clear success metrics like observations per patrolled cell and snare counts (Xu et al. 2019; Chen et al. 2021).
- Build route planning around multimodal constraints, vehicles, terrain, time, and safety, not idealized movement (Chen et al. 2021).
- Fund training, maintenance, and iteration, because pilots do not survive staff turnover without institutional support (Mahajan et al. 2023).
Data Visualizations
- Accuracy comparison, AUROC
2. Real-world field outcomes, observation rate by risk tier
3. Implementation gap, scale of adoption vs field-tested predictive planning
References
[1] Xu, Lily, et al. “Stay Ahead of Poachers: Illegal Wildlife Poaching Prediction and Patrol Planning Under Uncertainty with Field Test Evaluations.” arXiv, 6 Nov. 2019, arXiv:1903.06669.
[2] Chen, Wei, et al. “Data-Driven Multimodal Patrol Planning for Anti-poaching.” Proceedings of the AAAI Conference on Artificial Intelligence, vol. 35, no. 17, 2021, pp. 15270–15278.
[3] World Wildlife Fund. “Silence of the Snares: Southeast Asia’s Snaring Crisis.” WWF, 9 July 2020.
[4] Tilker, Andrew, et al. “Impact of 11 Years of Snare Removal in a Biodiversity Hotspot.” Conservation Letters, 2024, doi:10.1111/conl.13021.
[5] Interpol. “Illegal Wildlife Trade Has Become One of the World’s Largest Criminal Activities.” Interpol, 6 Nov. 2023.
[6] SMART Conservation Tools. “How We Use SMART.” SMART Conservation Tools, accessed 5 Mar. 2026.
[7] SMART Conservation Tools. “Predictive Patrol Planning for SMART: Field Testing PAWS in the Rio Bravo Conservation Management Area in Belize.” SMART Conservation Tools, 26 Aug. 2022.
[8] Lynam, A. J., et al. “The Rising Tide of Conservation Technology: Empowering the Fight Against Poaching and Unsustainable Wildlife Harvest.” Frontiers in Ecology and Evolution, 2025.
[9] Mahajan, S. L., et al. “Accelerating Evidence-Informed Decision-Making in Conservation.” Biological Conservation, 2023.
[10] Feldmeier, D. E., et al. “The Global Threat of Wire Snare Poaching: A Comprehensive Review of Impacts and Research Priorities.” Biological Conservation, 2025.

Leave a comment