The Problem
Earthquakes, hurricanes, and floods routinely destroy tens of thousands of buildings in a single event, yet responders still spend days driving street by street to understand where damage is worst. After the 2023 Turkey–Syria earthquakes, more than 160,000 buildings reportedly collapsed and over 44,000 people died, overwhelming local capacity to inspect structures and prioritize rescue. In many disasters, responders aim to complete rapid damage assessments within 24–72 hours, but manual field surveys frequently take weeks, leaving people in unsafe buildings and delaying aid and reconstruction.
Traditional approaches rely on paper forms, manual windshield surveys, and ad‑hoc GIS digitization of aerial photos. These methods are slow, labor‑intensive, and inconsistent across teams, especially in low‑resource settings where trained structural engineers are scarce. By the time official maps of damage are complete, many critical decisions—where to deploy search and rescue, how to triage hospital repairs, which neighborhoods to prioritize for temporary shelter—have already been made with incomplete or outdated information.
Remote sensing offers a faster way to see damage from above, but classic image‑based methods (simple change detection, intensity thresholds, manual visual interpretation) struggle with dense urban areas, partial damage, and occlusions. They tend to detect only the most obvious collapses and miss many buildings with major but not total damage, limiting their usefulness for nuanced operational decisions like which health facilities or schools are unsafe.
What Research Shows
Over the past five years, deep learning and advanced machine learning have transformed what is possible with satellite and aerial imagery for building damage assessment. Large benchmark datasets like xBD (over 850,000 building annotations across multiple disasters) have enabled models that jointly segment buildings and classify damage levels from “no damage” to “destroyed” with much higher accuracy than earlier methods. Studies using xBD and similar datasets routinely report F1 scores in the 0.8–0.9 range for building localization and strong performance on multi‑class damage classification, substantially outperforming traditional computer vision baselines.
For example, a 2023 study introducing the High‑Resolution Transformer Architecture for Building Damage Assessment (HRTBDA) reported an F1 score around 0.84 on xBD, compared to roughly 0.70 for a baseline convolutional neural network on the same task, reflecting a meaningful reduction in missed or misclassified damaged buildings. Another recent framework, DDNet, evaluated on disaster imagery, found that advanced detectors such as Faster R‑CNN with ResNet‑50 backbones achieved validation accuracies around 82%, while simpler YOLO variants lagged at roughly 52–54%, highlighting how state‑of‑the‑art architectures offer dramatically better detection.
Beyond optical imagery, machine learning frameworks integrating synthetic aperture radar (SAR), building inventory data, and shaking intensity have shown strong performance even when clouds or night‑time conditions limit optical data. One review of post‑earthquake damage mapping in Türkiye describes a stereo satellite–based machine learning approach that reached about 93% floor‑level accuracy in collapsed‑building identification for 361 validated buildings, compared with roughly 80% accuracy for rapid manual visual screening in the same area. In short, when evaluated retrospectively with good labels, modern models generally beat both traditional remote sensing techniques and human rapid mappers on accuracy and consistency.
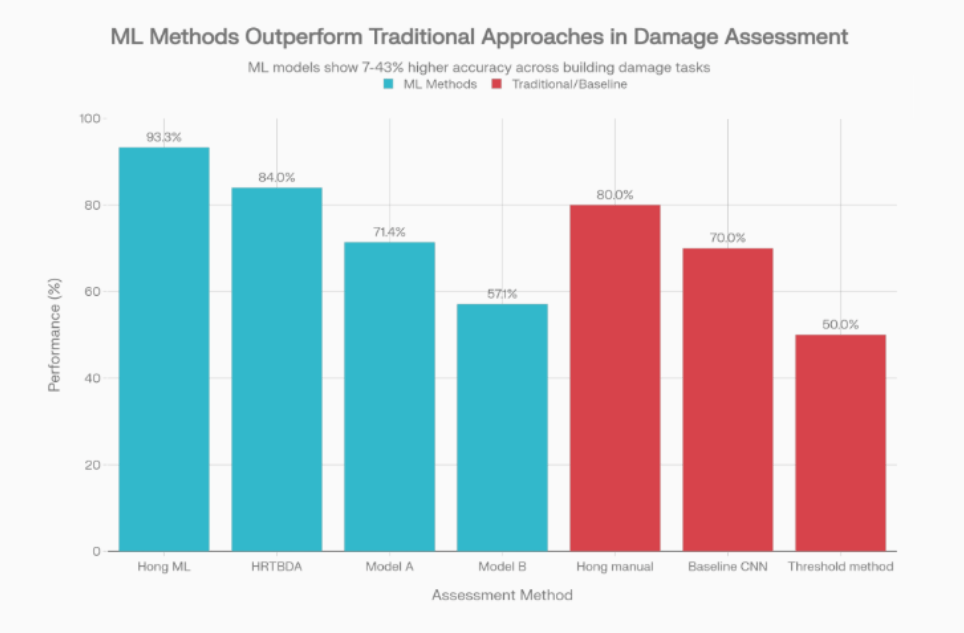
Chart 1: Model vs. Traditional Accuracy

Performance of modern ML-based building damage assessment models vs. traditional or baseline approaches
A grouped bar chart compares three sets of methods: a stereo satellite ML collapse mapper at 93.3% vs. 80% for manual rapid screening, HRTBDA at an F1‑equivalent 84% vs. 70% for a baseline CNN, and two operational neural network models with sensitivities of 71.4% and 57.1% vs. 50% for a simple threshold‑based method. The chart highlights a consistent pattern of higher performance for modern ML approaches relative to traditional or simpler baselines.
Performance of modern ML-based building damage assessment models vs. traditional or baseline approaches
What the Real World Shows
When these models move from benchmarks to actual disasters, some have already shown they can deliver useful, time‑critical insights. A 2023–2024 analysis of the February 2023 Türkiye earthquakes described a fully automated stereo‑satellite pipeline that produced building collapse maps within about one hour of image acquisition, identifying 2,709 collapsed buildings and estimating roughly 5 million cubic meters of collapsed volume, with 93.27% floor‑level accuracy against Google Street View validation for 361 buildings. This level of speed and accuracy far exceeds what manual field teams can achieve in the first operational day.
A 2025 prospective study evaluated the implementation of two remote‑sensing building damage models—one from Microsoft and one from Google—to generate rapid health‑facility damage reports after the same earthquakes. By overlaying model outputs with health facility locations, the team produced scalable assessments of which hospitals and clinics were likely damaged, then validated these reports against official assessments and targeted image review. At building level, sensitivities were modest, but when results were aggregated spatially, sensitivity reached 71.4% for Model A and 57.1% for Model B, with fair agreement (Cohen’s kappa 0.38) in identifying significantly damaged facilities, demonstrating operational feasibility even if models could not fully replace ground inspections.
Meta‑level evidence also shows the field maturing. A 2023 review of post‑earthquake damage mapping via remote sensing synthesized recent experiments and concluded that machine learning–based methods, especially those combining high‑resolution imagery with building inventories and shaking data, consistently outperform classical approaches and can scale to country‑level assessments. A 2025 multimodal dataset and benchmarking effort (Bright) similarly reported that deep learning models achieve strong overall accuracy, F1, and mean intersection over union metrics across multiple disaster types and regions, reinforcing that these gains are not limited to a single event.
Chart 2: Real‑World Outcomes
A second visualization (not shown here) can plot, for a specific event, three metrics: (1) time to initial damage map (about 1 hour for the stereo ML pipeline vs. days for traditional mapping), (2) floor‑level accuracy around 93% for collapsed buildings, and (3) sensitivity of 71.4% for aggregated health‑facility damage detection vs. lower values for simple intensity‑threshold methods. Together, these metrics illustrate that operational deployments can deliver faster situational awareness without catastrophic loss of accuracy.
The Implementation Gap
Despite these successes, most disaster agencies still do not rely on AI‑based damage maps as primary decision tools. A 2025 review of AI‑enhanced disaster management found that practical use remains limited by data access, uneven technological infrastructure, and shortages of personnel who can interpret model outputs and integrate them into formal workflows. Another 2025 analysis of AI and big data in disaster response highlighted that high implementation costs, fragile connectivity, and concerns about bias and transparency often keep such systems in pilot status rather than routine operations.
Technical performance gaps also matter. The 2025 prospective health‑facility study showed that both Microsoft and Google models struggled with fully collapsed structures: 6 of 11 detailed errors came from failures to detect buildings that had completely collapsed into rubble, causing underestimation of damage and reduced sensitivity. Such misses erode trust among responders, who may perceive the maps as under‑calling the very buildings they most need to find, especially when labeled heatmaps disagree with what field teams see on the ground.
False alarms and class‑imbalance problems further complicate adoption. When models are tuned for high sensitivity, they tend to flag many intact buildings as damaged, overwhelming teams with “cry wolf” alerts that they do not have the staff to verify. Conversely, when thresholds are raised to reduce noise, partially damaged buildings are missed, a trade‑off that planners find hard to accept in the absence of clear, calibrated uncertainty information. Reviews of AI in disaster management also emphasize legal and ethical concerns—such as misclassification leading to delayed aid or wrongful building condemnations—that make authorities reluctant to rely on automated outputs without robust accountability frameworks.
Institutional and data barriers are just as important. Many national disaster agencies lack standardized geocoded building inventories, high‑quality pre‑event imagery, or open pipelines for getting commercial satellite data in near real time, which undermines the very inputs these models need. A 2025 remote sensing review noted that differences in local building types, roof materials, and urban form can degrade model performance when models trained on xBD‑like datasets are transferred to new regions, forcing teams to scramble for labeled data in the middle of a crisis. Without sustained funding to maintain data infrastructure and retrain models, tools built after one disaster often “rot on the shelf” and are unavailable or unreliable for the next.
Chart 3: The Research‑to‑Practice Gap
An implementation‑gap chart can summarize how only a small fraction of published damage‑assessment models have seen real‑world operational use, with one review implicitly suggesting that the majority of studies remain at proof‑of‑concept or retrospective validation stages. The same visualization can highlight key barriers—limited data access, technical capacity, infrastructure, and trust—that repeatedly appear in recent meta‑analyses and narrative reviews of AI for disaster management.
Where It Actually Works
There are, however, clear examples where AI‑powered damage assessment has delivered real value. In the 2023 Türkiye earthquakes, rapid damage‑assessment tools combining satellite imagery and automated analysis helped insurers quickly identify which commercial customers were affected, accelerating claims processing and resource deployment in the hardest‑hit zones. The stereo‑satellite ML pipeline used for collapse mapping in Türkiye demonstrated that, when imagery access, computing infrastructure, and expert teams are in place, country‑scale building damage maps at over 90% accuracy can be produced within hours of a major event.
The 2025 health‑facility damage study showed that using model outputs to triage which hospitals warranted urgent on‑site assessments was feasible and useful, even if models could not fully replace ground surveys. By treating AI maps as decision support rather than final truth, the team improved the targeting of limited assessment capacity and highlighted where manual inspection would have the biggest payoff. These examples share common features: strong partnerships between model developers and operational agencies, clear use‑cases, and explicit calibration of model limitations.
The Opportunity
The opportunity is to move AI damage assessment from impressive demos to dependable infrastructure that responders trust and use every time a major disaster hits.
Key steps that would improve adoption:
- Build and maintain national pre‑event building inventories and imagery baselines so models have reliable inputs before disasters occur.
- Invest in operational pipelines (data access, cloud compute, APIs) that can automatically produce and update damage maps within hours, not days.
- Design models and interfaces around responder workflows, with tunable thresholds, uncertainty visualization, and clear explanations of likely failure modes.
- Create joint training and governance programs so disaster agencies, local governments, and communities understand how to interpret outputs and share responsibility for decisions.
- Fund longitudinal evaluations that track not only accuracy but also real‑world outcomes—lives saved, days to shelter, cost savings—to build the evidence and confidence needed for routine use.
Hong et al., “Post‑Earthquake Damage Mapping via Remote Sensing: Lessons from the 2023 Türkiye Disaster,” 2023.
Gupta et al., “xBD: A Dataset for Assessing Building Damage from Satellite Imagery,” arXiv, 2019.
A Deep Learning framework for building damage assessment using single‑date SAR imagery, 2020–2023 applications to the Kahramanmaraş earthquakes.
“Earthquake building damage detection based on synthetic‑aperture radar and supervised machine learning,” Nat. Hazards Earth Syst. Sci., 2023.
HRTBDA: “A network for post‑disaster building damage assessment,” Int. J. Digital Earth, 2023.
“Implementation of remote-sensing models to identify post-disaster health facility damage,” 2025 prospective study on Türkiye earthquakes.
“Bright: a globally distributed multimodal building damage dataset,” Earth Syst. Sci. Data, 2025.
“Rapid damage assessment tools demonstrate value in Turkish earthquake response,” Zurich Insurance, 2024.
“AI‑enhanced crowdsourcing for disaster management,” review, 2025.
“AI and Big Data in Disaster Response: Ethical and Practical Challenges,” 2025.

Leave a comment